Marble's Secrets Part II - Walking In The Shoes Of Slartibartfast ...
In Part I we have seen how easy it is to create your own maps for Marble. We've also seen how this works down to the zoom level of aerial photos or OpenStreetMap. Part II will show how Marble manages to provide the biggest bang for the byte when it comes to providing map data. It outlines how we managed to get the default map squeezed into the 10MB package that the Marble-Qt version gets shipped with. We basically show ...
Why Marble is the perfect choice for Asus EeePC, OLPC & Co and some Embedded Devices ... ;-)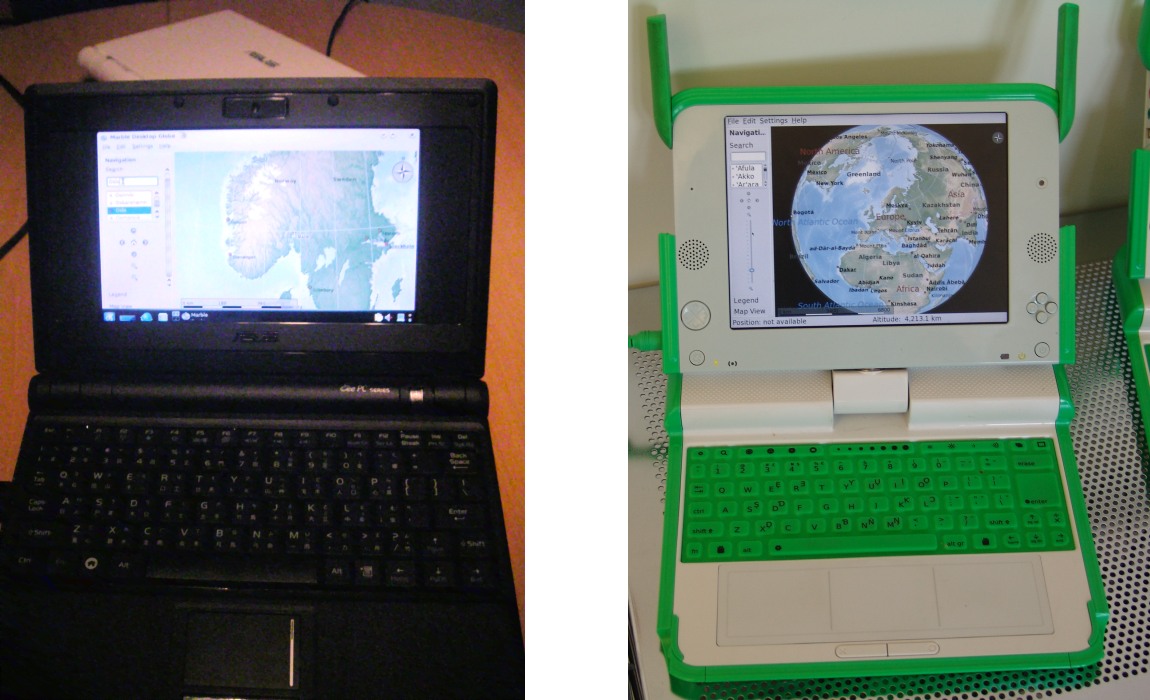 Caption: Marble running on my Asus EeePC and on the OLPC (OLPC photo kindly provided by Bernhard Rosenkränzer of ArkLinux fame)
If you followed our last part closely and did a bit hands-on work then you maybe have stumbled across the contents of ~/.marble/data/maps/earth/srtm . This one contains part of the data for the default topographic view which is pretty colorful to mimic the appearance of a typical school atlas. Although the Marble application focuses on the educational aspect that's only one reason why we default to the topographic map:
If you look at the actual tiles of the "Atlas" map then you will realize that they are all provided as grayscale bitmaps! If you actually replace "false" by "true" in line 10 of the srtm.dgml-textfile (which is likely placed in /usr/share/apps/marble/data/maps/earth/srtm/srtm.dgml if you're on a Linux/UNIX system) then your line should look like this:
Restart Marble and choose the "Atlas" map, zoom out a bit and you can see the grayscale data in "raw mode" in its full dull beauty. Actually you'll find out that it has a blue tint as Marble just applies the grayscale data to the blue color channel.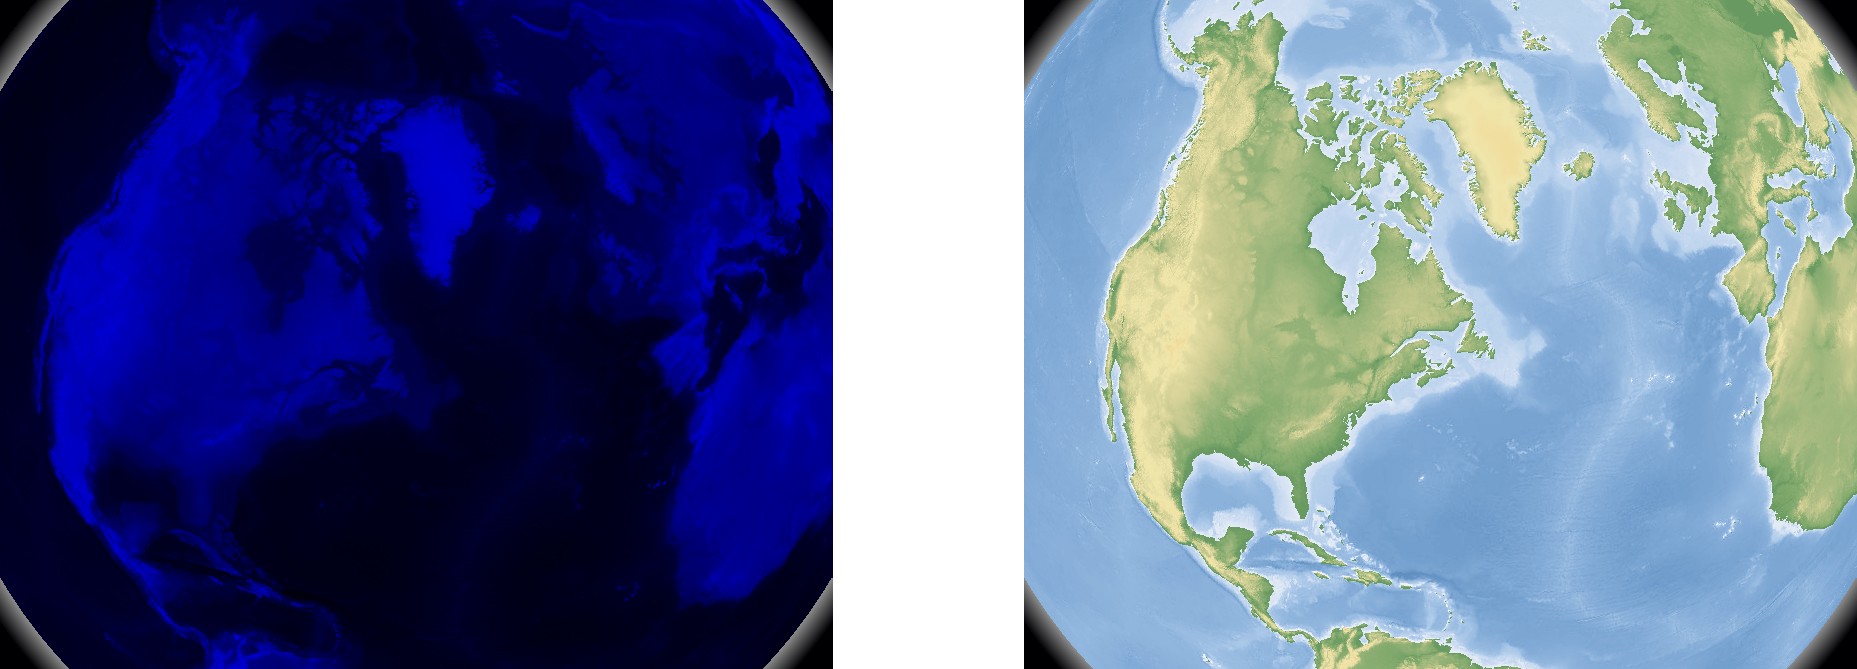
So apparently Marble takes the grayscale data, and somehow applies colors to it! This is pretty smart: All tiles get stored as JPG's. But grayscale images use up a lot less space on the hard disc drive than color images. Color images just need four bytes (RGBA) per pixel while grayscale only needs a single byte per pixel! And you can even compress grayscale tiles a lot more than color tiles: Usually people feel offended by highly compressed JPGs due to the violet-pinky artefact-shades that result from an overly compressed JPG-file.
With grayscale images this artefact is gone and it's much harder to tell a highly compressed image from an uncompressed one! That's the reason why Marble can store a lot more map data (about 4 times as much) in Atlas View than it would be possible in Satellite View!
The grayscale shades actually represent heights. In fact those grayscale shades are based on data that was acquired during the Shuttle Radar Topography Mission" ("SRTM") back in February of 2000: A radar system that flew onboard the Space Shuttle Endeavour during STS-99 mission obtained digital elevation models on a near-global scale from 56 °S to 60 °N. While Marble only ships part of the data the whole SRTM provides the most complete high-resolution digital topographic database of Earth to date! That's why the GIS community loves the SRTM data so much.
Now if we would just map those grayscale values to color values and if we would colorize our map that way then we would get a beautiful and clean map. We'd just choose a green-yellow-brown palette for all grayscale-values which represent heights above sea level. And we'd choose a blueish palette for everything below sea level - but wait: There are some large areas, e.g. in northern africa, which are actually below sealevel and which are not filled with water!
However several moons ago when Marble hatched from its spherical egg it worked exactly as suggested before. Back then it actually looked like this. Look at the upper coastline of africa and you'll spot some blue patches of water which are actually not supposed to be there ...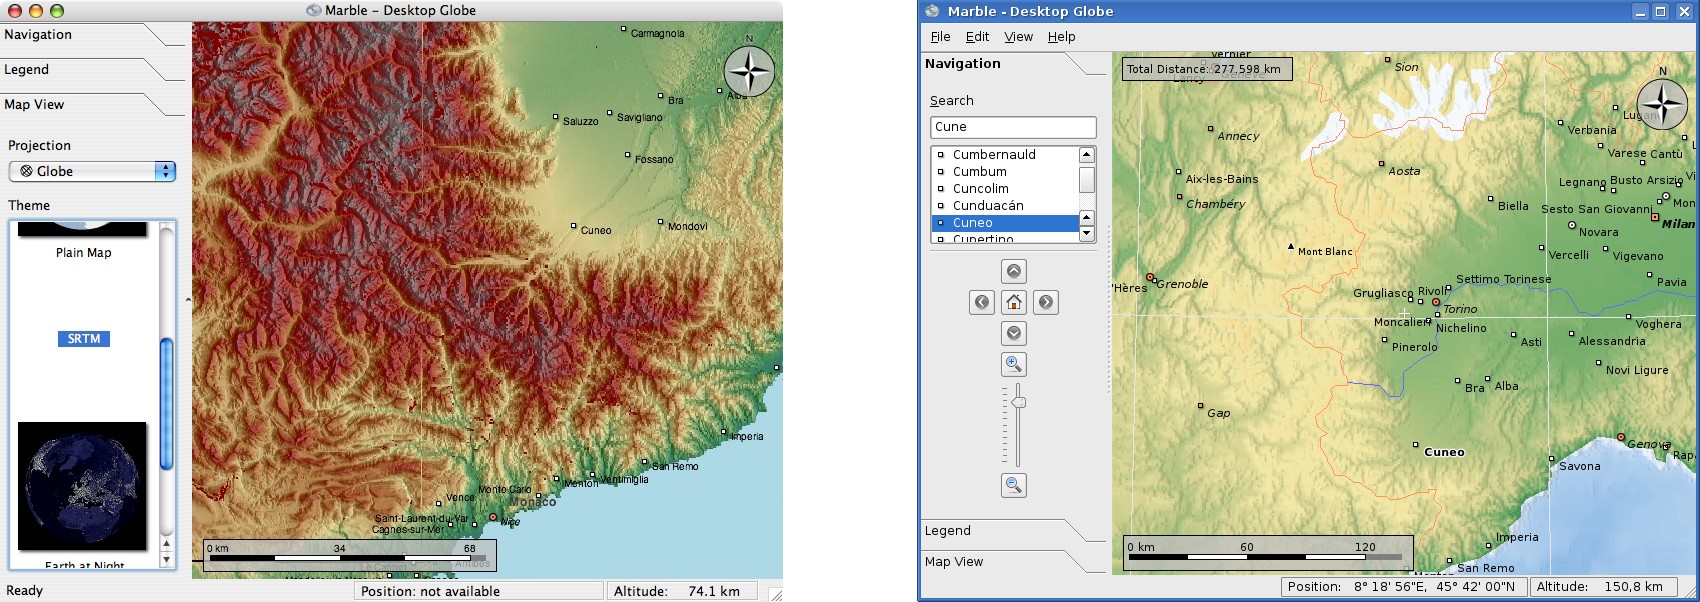 Caption: Left: Marble on MacOS X using beautiful high-res full-color SRTM tiles created with Mapnik (Credits: Artem Pavlenko). Right: Marble using the Altas map: notice the vector coastline blending with the texture data).
So we need some data for a coast line which enables us to choose the correct palette for the land and for the sea. Marble right now ships with such data which was very popular back in the 90ies: The "Micro World Database II" - which is based on some work by the Central Intelligence Agency, "CIA" back in the 80ies and has been updated a bit since then. The nice thing about it is that it provides a lot of vector data on as little as about 2 Megabytes: Coastlines, islands, boundaries, lakes and rivers (and we added some more). And yes, MWDBII and SRTM are available under the public domain.
So if we use that to colorize our map we get what we have in the screenshot above. Watch the close-up screenshot on the right to see the vector coastline and the texture data pixels nicely blending together!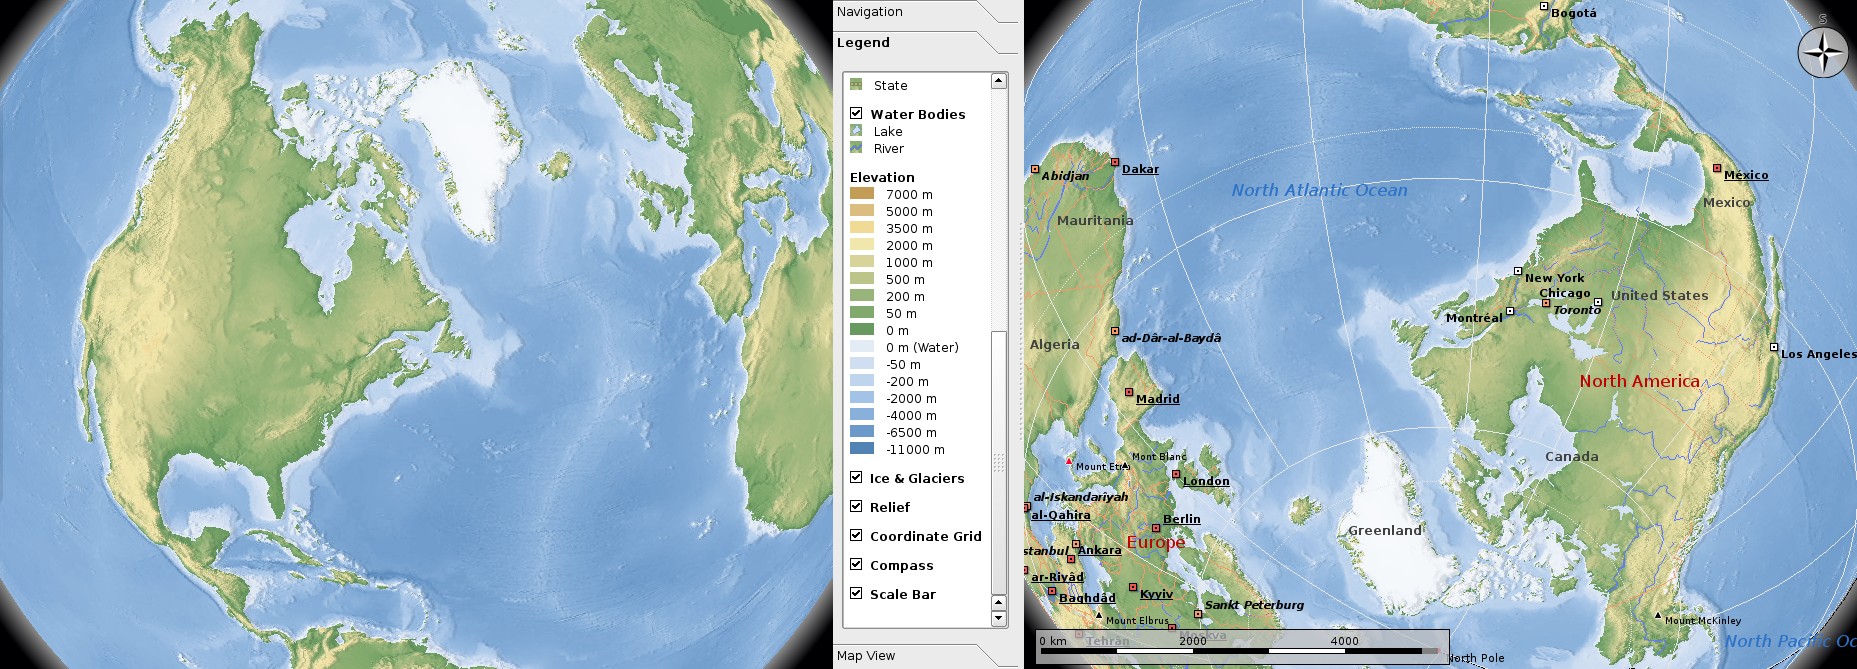 Caption: Marble with real-time height relief: Watch the shadows on the left image and on the right image which is the same image with the globe tilted upside down: on both images the shadows fall to the right.
Given that SRTM provides elevation data we could add some highlights and shadows, right? Indeed Marble reuses the very same grayscale data to apply cheap bumpmapping in a way that preserves the vivid colors. Marble does this at runtime for each single frame: so no matter how you rotate the earth, the shadows will always fall to the right.
We also reuse the very same colorization trick for the permanent ice on the earth as you can see in the same screenshot. On top of this texture layer we add all those lovely vector lines that represent countries, rivers, lakes, etc. . Then we have our world cities and places which get imported from a set of Google Earth KML files that Marble is using. As a finishing touch the coordinate grid, the compass and the scalebar get added. Right now the whole rendering of the map is done in software (without using SIMD or assembler). This means that Marble will provide a pixel-perfect cross-plattform rendering at acceptable speed on every single computer that has got Qt4 installed.
Additionally we are working towards having an optional OpenGL view-plugin for speed-intoxicated Gear^WMarbleheads in the future.
I Am Legend
As a user you can play around with these different layers by clicking the "Legend" tab on the left. Just check or uncheck the checkboxes. In the legend there's also a list that explains the color codes of the elevation data.
As a die-hard armchair-GISmaniac you can even change the colors for the vector line features easily using your favorite text editor: Have a look at the Plain Map's plain.dgml - there are some new tags in there which are pretty self-explaining.
Marble Junior Jobs
It's time again for Marble Junior Jobs. If you've ever tried to become a famous rockstar coder then this is your chance to become a real Marblehead: First you need to spend 10 minutes to get Marble from the sources and to compile it. You need to check out Marble "trunk". Once this is done the Marble World is waiting for you:
It's your job to add internal support for miles: Have a look at marble/src/lib/global.h. It contains a line that defines (Yes, we need to introduce an "earth model" at some point in the future ...):
const double EARTH_RADIUS = 6378000.0;
So search the source code for "EARTH_RADIUS" and find a way to support other units than meter. Once you found a solution think about how you can change your solution to become "more elegant" and "more flexible".
For help or questions you can join us on IRC ( irc.kde.org, #kde-edu ) or send a mail to our mailing list.